
Per ottimizzare un'infrastruttura globale, sono necessari dati granulari su chi sta consumando i tuoi contenuti. La Richieste di traduzione La dashboard funge da unità di telemetria centrale. Traccia ogni istanza in cui il motore MultiLipi serve una pagina tradotta, aggregando questi dati in visualizzazioni di serie temporali. Ciò ti consente di distinguere tra lingue passive (abilitate ma non utilizzate) e mercati attivi (alto consumo), convalidando il tuo ROI di localizzazione.
Questa guida illustra la navigazione e l'interpretazione dei tuoi dati sul traffico linguistico.
2. Architettura della Dashboard
Comprendere i segnali.
A. Richieste di traduzione totali (Carico aggregato)
Visualizza: Un grande indicatore numerico nella parte superiore del pannello.
Definizione: Questo rappresenta il numero totale di "Chiamate di traduzione" effettuate alla nostra API in tutte le lingue.
Nota tecnica: Una chiamata viene attivata ogni volta che un visitatore carica una pagina in una lingua di destinazione (tramite LiveJS, sottodirectory o sottodominio). È un indicatore diretto di "visualizzazioni di pagina localizzate".
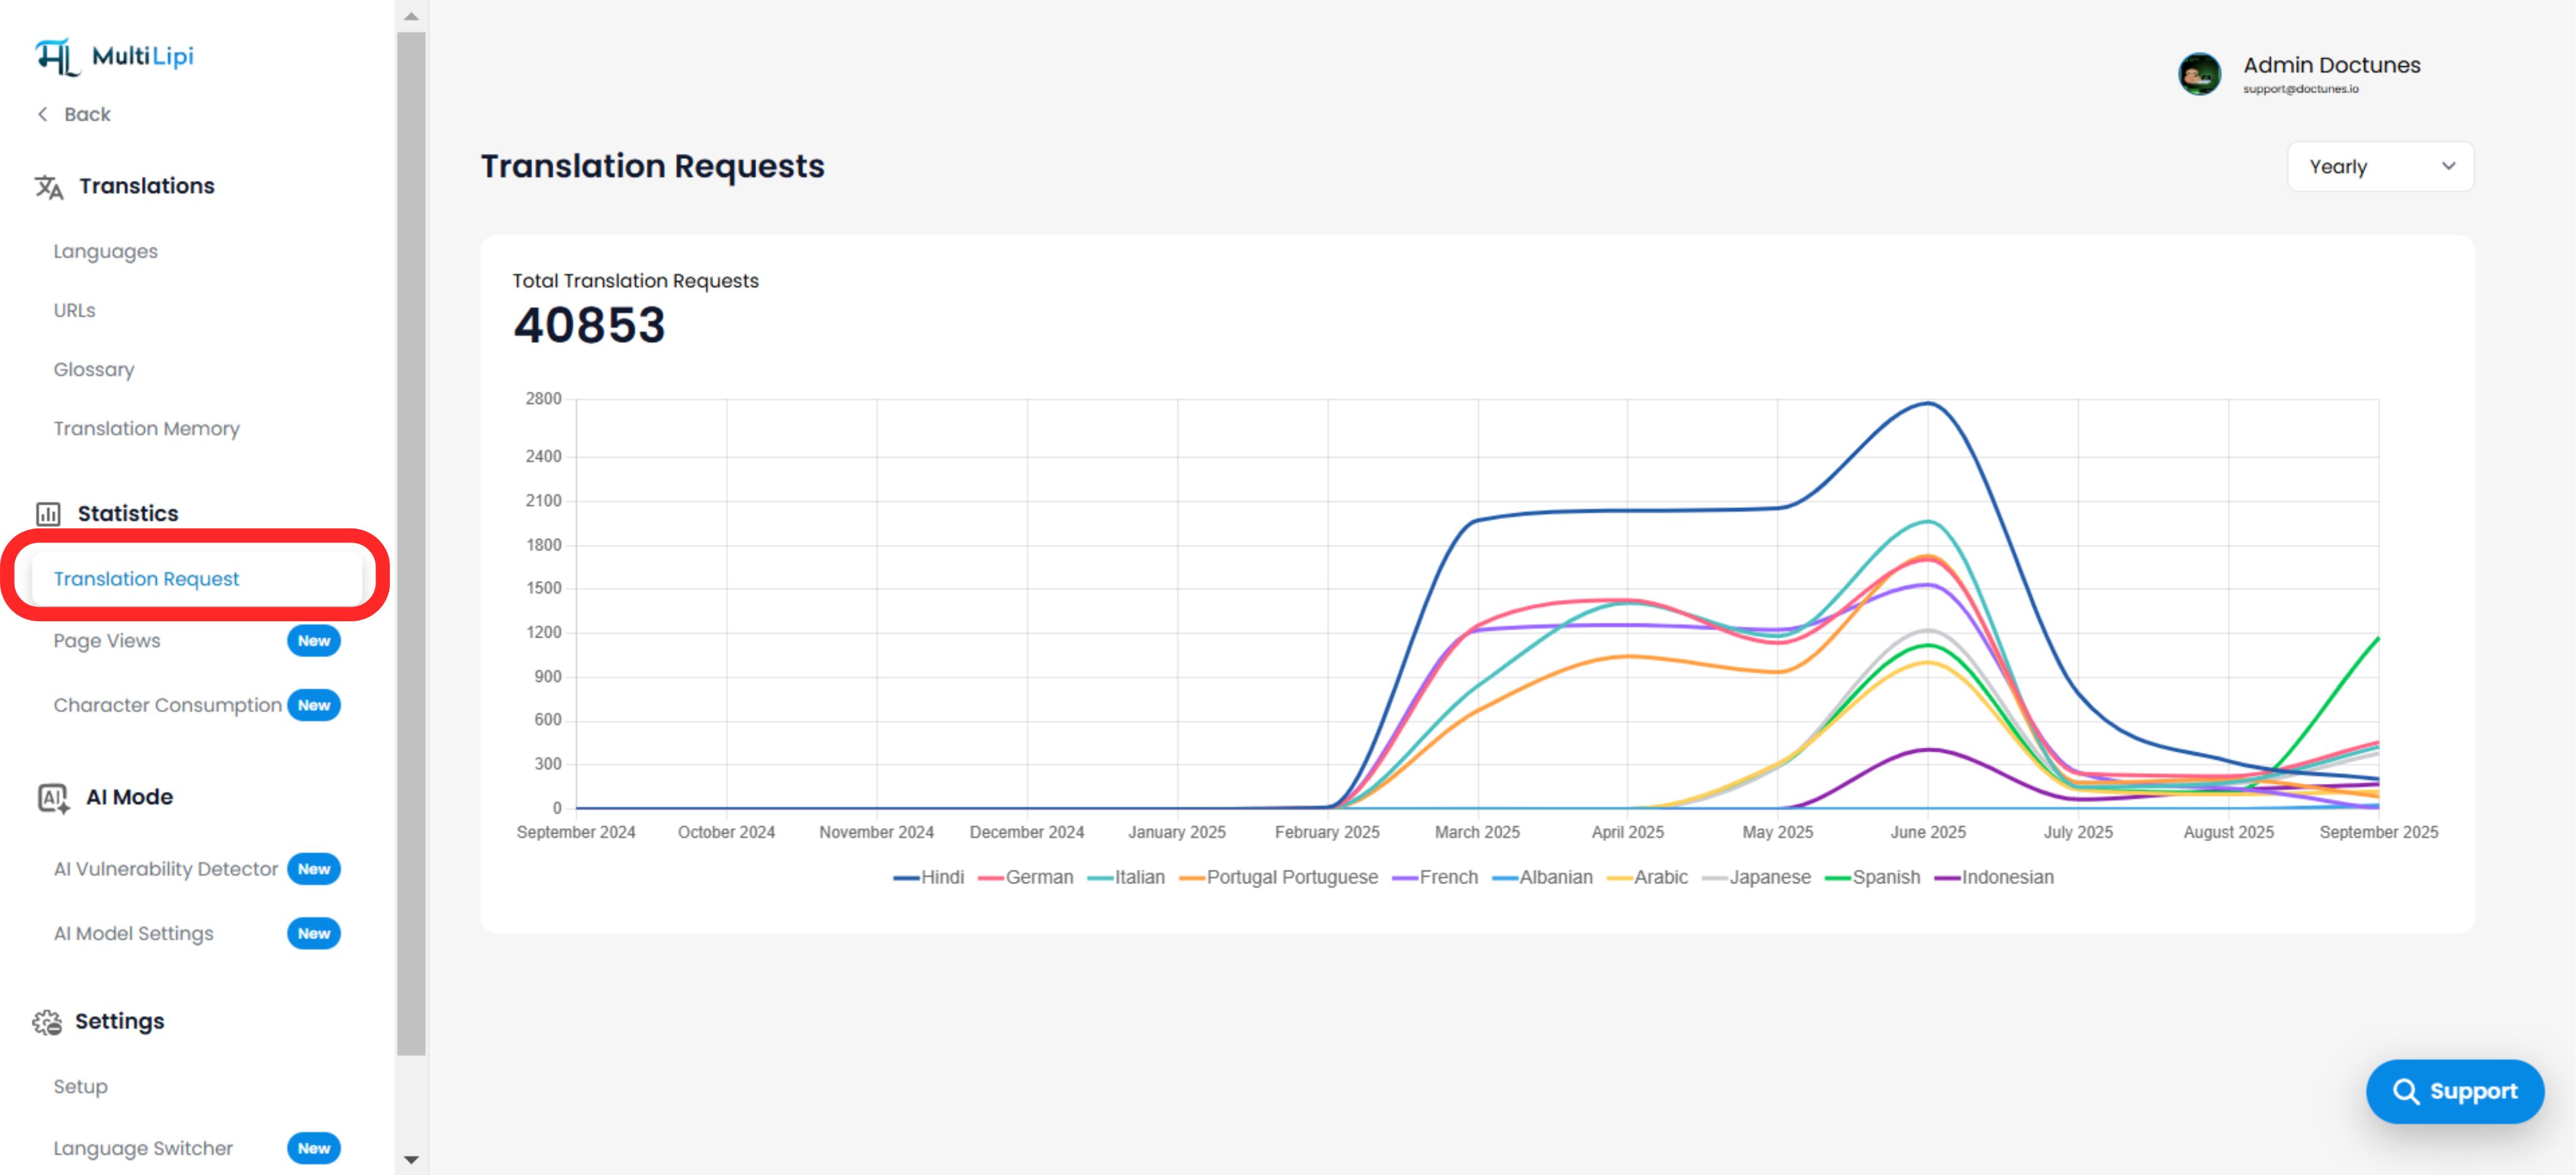
B. Serie Temporali per Lingua (Il Grafico dell'Andamento)
Visualizzazione: Un grafico a linee multicolore che tiene traccia delle prestazioni nel tempo.
Asse Y (Volume): Numero di richieste/visualizzazioni.
Asse X (Tempo): Cronologia (Mesi/Settimane).
Legenda: Ogni colore rappresenta una lingua distinta (es. Hindi = Blu, Spagnolo = Rosso).
Intuzione: Questa visualizzazione rivela volatilità e crescita. Una linea piatta indica stagnazione; un picco indica una campagna di successo o un evento virale in quella regione.
3. Controlli di granularità (Filtri temporali)
Ingrandire i dati.
Puoi regolare la granularità dei dati utilizzando il menu a discesa del filtro nell'angolo in alto a destra:
| Filtro | Caso d'uso |
|---|---|
| Quotidiano | Debug: Il traffico è sceso a zero ieri? (Potenziale problema DNS). |
| Settimanalmente | Monitoraggio delle campagne: Monitoraggio dell'impatto immediato di una nuova pubblicità localizzata. |
| Mensile | Report sulle prestazioni: Report di alto livello per gli stakeholder. |
| Annuale | Stagionalità: Identificazione di tendenze a lungo termine (ad es. picchi di traffico tedesco a dicembre). |
4. Intelligenza strategica
Trasformare i dati in decisioni.
Validazione del mercato
Se vedi un picco di traffico in spagnolo a settembre 2025, convalida che la tua localizzazione in spagnolo sta generando un valore reale. Potresti dare priorità all'aggiunta di ulteriori contenuti per questa regione.
Allocazione delle risorse
Se il tedesco ha zero richieste per sei mesi, potresti prendere in considerazione la sua deprecazione o indagare se il selettore di lingua è rotto per gli utenti tedeschi.
Monitoraggio SEO
Un aumento improvviso e sostenuto in una lingua specifica indica spesso che Google ha iniziato a indicizzare le tue sottodirectory tradotte (ad esempio, /hi/) per quella regione.